
01
Active participation, not enrolment
The share of members who earned in the last period shows whether the programme is alive. Enrolment only shows that the launch happened.
Typical action
- Trigger re-engagement for lapsing members
Engagement intelligence · Analytics
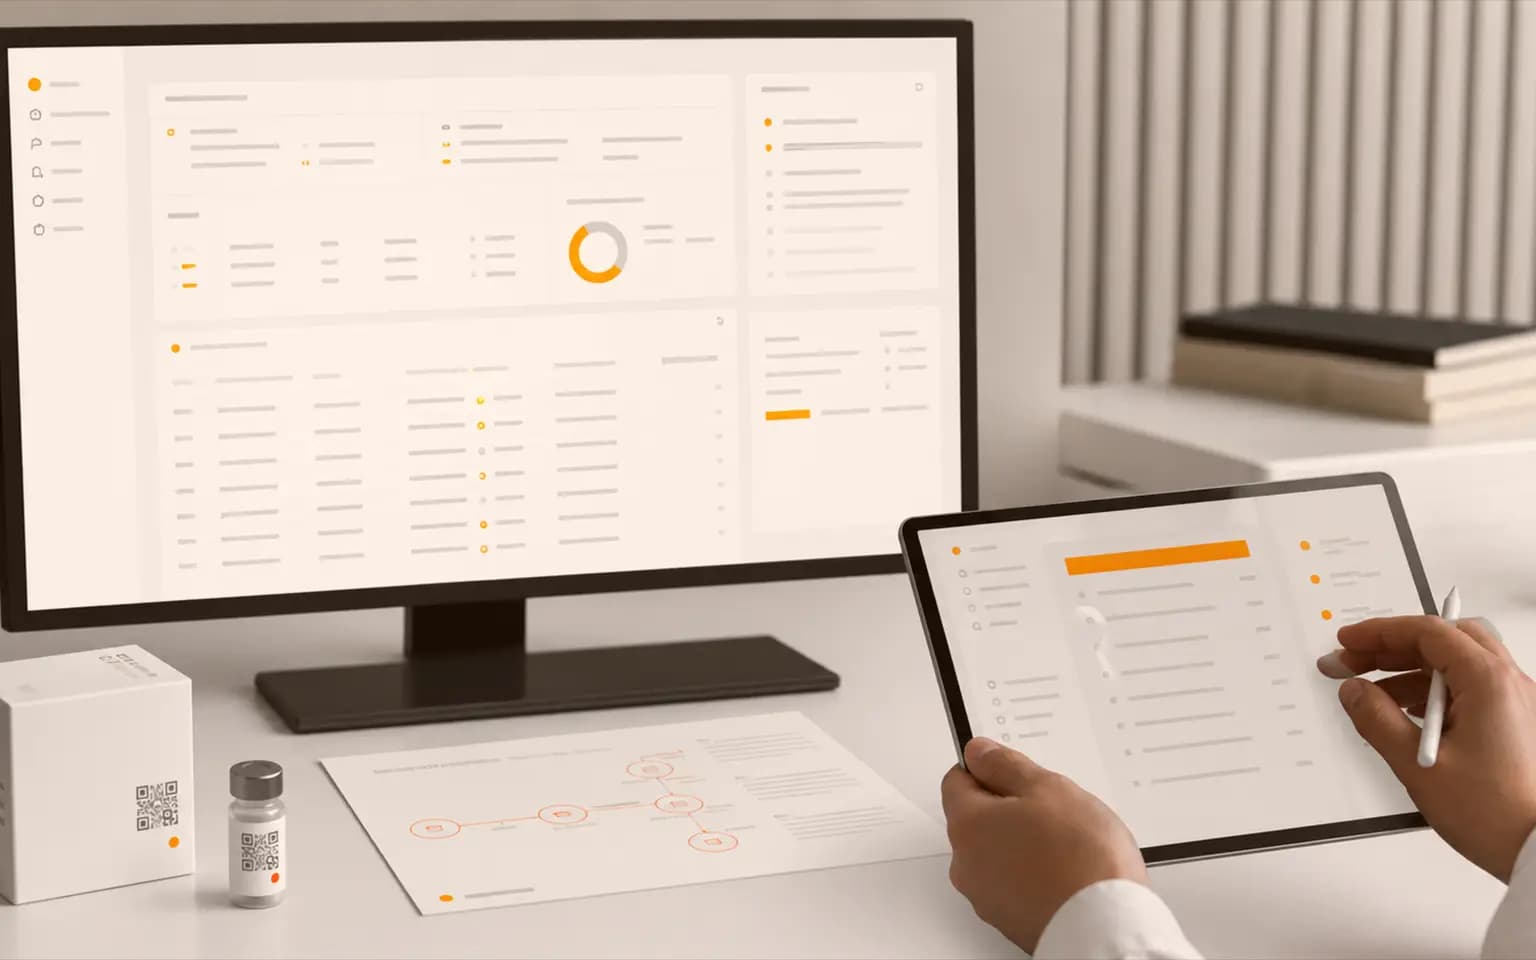
Total members and total points are easy to report and rarely change a decision. Experience across hundreds of programmes points to a smaller set of measures that show early whether engagement is holding, where the channel is leaking and what to change next.
01
The share of members who earned in the last period shows whether the programme is alive. Enrolment only shows that the launch happened.
Typical action
02
How long it takes a new member to earn or scan a second time is one of the earliest signs of whether they will stay. A long gap usually calls for an onboarding journey.
Typical action
03
Too few redemptions means members don't value the rewards. Too many, too quickly, can signal leakage. Outstanding point liability keeps finance confident in the programme.
Typical action
04
For dealer and installer programmes: how many active outlets or professionals per territory, and how concentrated earning is among a few of them.
Typical action
05
Scan velocity, geographic mismatches, duplicate attempts and unusual redemption patterns, reviewed routinely rather than after a loss.
Typical action
06
Where products are scanned compared with where they were shipped shows diversion and parallel trade, and shows which markets are engaging.
Typical action
AIQR includes scan reporting, transaction and programme reporting. The specific dashboards and alerts for a rollout are configured during implementation based on the agreed measurement plan.
Yes. Programme and scan data can be exported or integrated with your BI and CRM systems. The integration method is agreed per deployment.
Early indicators such as time to second action and active participation show direction within the first programme cycles, well before annual totals do.
Share your current programme reports. We'll show you which metrics to keep, which to drop and which to add.
Review your programme metrics